


Table of Contents
Understanding Dynamic Reports in Salesforce:Key Components of Dynamic Reports in Salesforce:
1. Data Sources and Integration:
2. Interactive Visualisations:
3. Parameterisation and Filtering:
4. Dynamic Data Refresh:
5. Interactivity and User Controls:
6. Customisable Dashboards:
7. Export and Sharing Options:
8. Performance Optimisation:Building Dynamic Reports in Salesforce:
1. Understanding Data Sources:
2. Report Types and Filters:
3. Visualisation Options:
4. Dynamic Dashboards:
5. Real-Time Data Updates:
6. Collaboration and Sharing:
7. Mobile Access and Responsive Design:
8. Integration with External Systems:Best Practices for Dynamic Reporting:
1. Define Clear Objectives:
2. Understand User Requirements:
3. Select Appropriate Data Sources:
4. Design Intuitive User Interfaces:
5. Optimize Performance and Scalability:
6. Ensure Data Security and Privacy:
7. Foster Collaboration and Knowledge Sharing:
8. Regularly Review and Iterate:Conclusion:
Understanding Dynamic Reports in Salesforce:
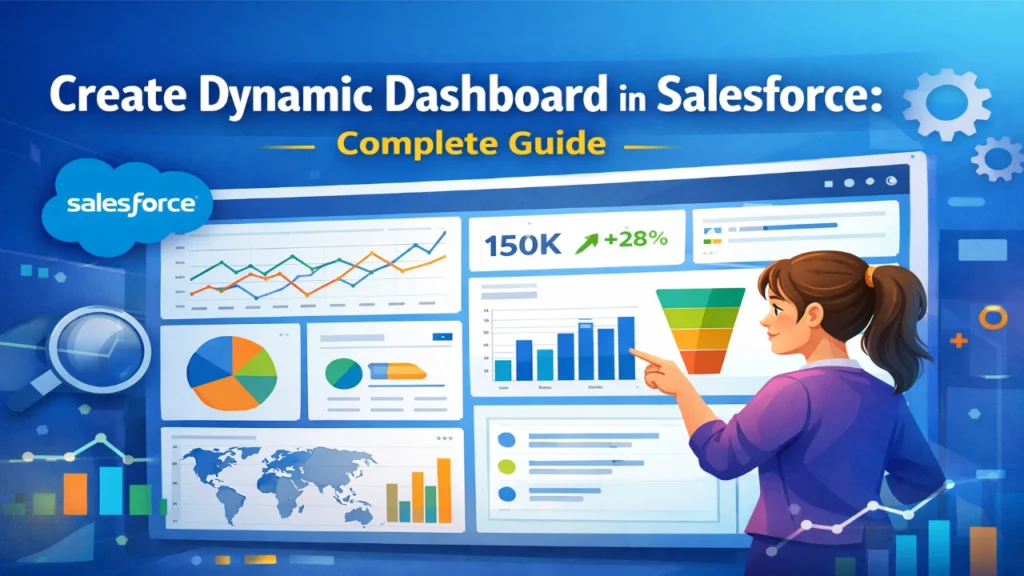
Dynamic Reports in Salesforce offer a versatile approach to generating reports that evolve with changing data. They incorporate features like filtering, grouping, and real-time updates, enabling users to tailor reports to their precise requirements. These reports automatically adjust to reflect the latest data, facilitating swift decision-making based on up-to-date insights. With customisable layouts and visualisations, Dynamic Reports in Salesforce empower users to present information effectively, fostering collaboration and boosting productivity within Salesforce environments. They serve as a powerful tool for analysing data and extracting actionable intelligence, ultimately driving better business outcomes.
Key Components of Dynamic Reports in Salesforce:
Dynamic reports in Salesforce are a crucial tool in various fields, from business analytics to scientific research, as they allow users to interactively explore and analyze data. These reports are characterised by their ability to adapt to user input, update in real-time, and provide insights through interactive visualisations. Below are the key components of Dynamic Reports in Salesforce, along with detailed explanations:
1. Data Sources and Integration:
Dynamic Reports in Salesforce typically pull data from multiple sources, which could include databases, spreadsheets, APIs, or live data streams.
Integration capabilities enable the report to fetch fresh data automatically, ensuring that insights are based on the most recent information available.
2. Interactive Visualisations:
Dynamic reports in Salesforce rely heavily on interactive visual elements such as charts, graphs, maps, and tables.
Users can manipulate these visualisations in real-time, adjusting parameters, filtering data, or drilling down for more detailed information.
Interactivity enhances user engagement and facilitates deeper exploration of data patterns and trends.
3. Parameterisation and Filtering:
Dynamic reports in Salesforce allow users to set parameters and apply filters to customise the displayed data.
Parameters might include date ranges, geographic regions, product categories, or any other relevant variables.
Filtering options empower users to focus on specific subsets of data, enabling targeted analysis and insights generation.
4. Dynamic Data Refresh:
Unlike static reports, dynamic reports update automatically as underlying data changes.
Real-time or scheduled data refreshes ensure that users always have access to the latest information without manual intervention.
Dynamic data refresh enhances the accuracy and relevance of insights presented in the report.
5. Interactivity and User Controls:
Dynamic Reports in Salesforce offer various user controls and interactive elements to facilitate exploration and analysis.
These controls could include sliders, checkboxes, dropdown menus, and input fields for adjusting parameters or selecting data subsets.
User-friendly interfaces enhance usability and empower users to extract insights efficiently.
6. Customisable Dashboards:
Dynamic Reports in Salesforce often feature customisable dashboards where users can arrange and configure visualisations according to their preferences.
Users can create personalized views tailored to their specific analytical needs or reporting requirements.
Customisable dashboards offer flexibility and cater to diverse user preferences and roles within an organization.
7. Export and Sharing Options:
Dynamic reports in Salesforce typically provide options for exporting data, visualisations, or entire reports in various formats such as PDF, Excel, or image files.
Sharing functionalities enable users to collaborate by distributing reports or sharing specific views with colleagues or stakeholders.
Export and sharing capabilities facilitate communication of insights and findings derived from Dynamic Reports in Salesforce.
8. Performance Optimisation:
Efficient data processing and rendering are crucial for the performance of dynamic reports, especially when dealing with large datasets or complex visualisations. visualisations.visualisations.
Optimization techniques such as data caching, lazy loading, and client-side rendering help ensure responsive and snappy user experiences.
Performance optimization minimizes latency and maximises the usability of dynamic reports, even when dealing with extensive datasets or intricate analyses.
Building dynamic reports in Salesforce involves leveraging the platform’s robust features for data visualisation, interactivity, and real-time data access. Salesforce offers powerful tools like Lightning Experience, Report Builder, and Dashboard Builder, which enable users to create compelling and insightful reports tailored to their specific business needs. In this summary, we’ll explore the key steps and considerations involved in building dynamic reports in Salesforce.
Before diving into report creation, it’s essential to understand the data sources available within Salesforce. This could include standard and custom objects, fields, and related data from external systems integrated with Salesforce.
Salesforce provides a unified data model that allows users to access and manipulate data across various objects, providing a comprehensive view of their business operations.
Report types define the primary object and its related objects from which data will be pulled for analysis. Salesforce offers standard report types for common entities like accounts, leads, and opportunities, as well as the ability to create custom report types tailored to specific business requirements.
Filters enable users to narrow down the data displayed in the report based on criteria such as date ranges, record ownership, or custom field values. Dynamic filtering allows users to adjust these criteria interactively, providing flexibility in data analysis.
Salesforce offers a variety of visualisation options to present data in an easily understandable format. These include bar charts, pie charts, line graphs, tables, matrices, and more.
Users can customise the appearance of visualisations by adjusting colours, labels, axes, and other properties to enhance clarity and readability.
Interactive features like drill-down capabilities enable users to explore underlying data in greater detail directly from the visualisations.
Dashboards in Salesforce serve as a central hub for monitoring key metrics and KPIs across the organization. Users can compile multiple reports and visualisations into a single dashboard to provide a comprehensive overview of business performance.
Dynamic dashboards allow users to interact with underlying reports, applying filters and adjusting parameters to explore data dynamically.
Salesforce Lightning Experience provides drag-and-drop functionality for easy customisation of dashboard layouts, enabling users to arrange components according to their preferences.
Salesforce offers real-time data access, ensuring that reports and dashboards reflect the most up-to-date information available in the system.
You can configure automated data refresh schedules to ensure that reports regularly update with fresh data, reducing the need for manual intervention.
Real-time data updates enable users to make informed decisions based on the latest insights, driving agility and responsiveness in business operations.
Salesforce facilitates collaboration and knowledge sharing by allowing users to share reports and dashboards with colleagues, teams, or entire organizations.
Sharing settings can be configured to control access permissions, ensuring that sensitive data is only accessible to authorised users.
Users can subscribe to receive scheduled report snapshots via email, keeping them informed of changes and updates without logging into the Salesforce platform.
Salesforce offers mobile-friendly interfaces, allowing users to access and interact with reports and dashboards from smartphones and tablets.
Reports and dashboards are designed with responsive layouts, ensuring optimal vivariousability across a variety of screen sizes and devices.
Mobile access enables users to stay connected and informed while on the go, empowering them to make data-driven decisions anytime, anywhere.
Salesforce can be integrated with external systems and data sources to enrich reporting capabilities and provide a holistic view of business operations.
Integration options include APIs, connectors, and middleware platforms that facilitate seamless data exchange between Salesforce and other systems.
By integrating with external systems, organizations can leverage data from multiple sources to generate more comprehensive insights and drive informed decision-making.
Dynamic reporting has become increasingly essential for businesses to derive insights from their data effectively. To ensure that dynamic reporting initiatives are successful and yield valuable insights, it’s crucial to follow best practices. Here are some key best practices for dynamic reporting:
Before diving into dynamic reporting, clearly define the objectives and goals you aim to achieve with your reports. Understanding the purpose of the reports will guide decisions regarding data sources, visualisation techniques, and interactivity features.
Align reporting objectives with broader business goals to ensure that dynamic reports provide actionable insights that contribute to strategic decision-making.
Identify the primary users and stakeholders who will interact with the dynamic reports. Conduct user interviews or surveys to understand their reporting needs, preferences, and pain points.
Tailor dynamic reports to meet the specific requirements of different user groups, providing relevant data and insights that support their roles and responsibilities.
Choose reliable and relevant data sources that provide accurate and up-to-date information for dynamic reporting. This may include internal databases, CRM systems, ERP systems, web analytics platforms, or external data sources.
Ensure data quality and consistency by implementing data governance practices and data validation procedures to prevent errors and inconsistencies in reporting.
Design dynamic reports with user experience in mind, ensuring that interfaces are intuitive, easy to navigate, and visually appealing.
Utilise interactive elements such as dropdown menus, sliders, checkboxes, and search filters to enhance user engagement and facilitate data exploration.
Provide clear instructions and tooltips to guide users on how to interact with the reports and interpret the visualisations effectively.
Implement performance optimization techniques to ensure that dynamic reports load quickly and respond smoothly, even when dealing with large datasets or complex visualisations.
Utilise data caching, lazy loading, and server-side processing to minimise latency and maximise responsiveness, particularly in web-based reporting applications.
Design reports with scalability in mind, allowing for future growth and expansion without sacrificing performance or usability.
Implement robust data security measures to protect sensitive information and prevent unauthorised access to dynamic reports.
Adhere to industry regulations and compliance standards such as GDPR, HIPAA, or PCI DSS to ensure the privacy and confidentiality of user data.
Utilise role-based access controls and encryption techniques to restrict access to sensitive reports and data based on user roles and permissions.
Encourage collaboration and knowledge sharing by enabling users to share dynamic reports with colleagues, teams, or stakeholders.
Provide commenting and annotation features that allow users to add notes, insights, or annotations to reports, facilitating communication and collaboration.
Foster a culture of data-driven decision-making by promoting the use of dynamic reports as a common platform for sharing insights and driving discussions.
Continuously monitor the performance and effectiveness of dynamic reports through user feedback, usage analytics, and performance metrics.
Regularly review and iterate on report designs, data sources, and visualisation techniques to ensure that dynamic reports remain relevant, accurate, and actionable.
Stay informed about emerging trends, technologies, and best practices in dynamic reporting to incorporate innovations and improvements into your reporting processes.
Dynamic reports in Salesforce offer a powerful means for organizations to analyze and visualise their data effectively. By leveraging Salesforce’s robust features such as Report Builder, Dashboard Builder, and Lightning Experience, businesses can create interactive reports and dashboards tailored to their specific needs. Many organizations also leverage Salesforce product development outsourcing to build customized reporting solutions and advanced analytics capabilities within their Salesforce environment. These reports enable real-time data access, intuitive visualisation options, and dynamic filtering capabilities, empowering users to gain actionable insights and make informed decisions.
Best practices such as defining clear objectives, understanding user requirements, and optimizing performance, organizations can maximise the value of dynamic reporting initiatives in Salesforce. Ultimately, dynamic reports in Salesforce serve as invaluable tools for driving business growth, enhancing productivity, and fostering a data-driven culture within organizations.
Founder and CEO of iTechCloud Solution, a Salesforce consulting and product partner since 2017. He sets engagement strategy and stays the commercial owner of every account, working with clients across Salesforce, AI and data from the first call through to go-live.
Connect on LinkedIn